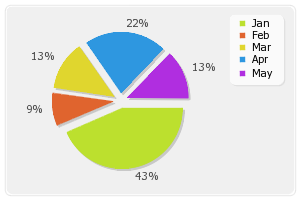
分かれた平面的な円グラフ
Example 13
円グラフは古典的な線/曲線/プロットグラフとはわずかに異なります。
まず第一に、データセットを1つ受け入れることができるだけです(この例のSerie1)。
あなたは、もう一つのデータセットで、ラベルが各々の点に結びついたことを示すこともできます(この例のSerie2)。
この例で、我々はpDataクラスのAddPoint()を使用してデータセットを手動で設定しています。
それから、SetAbsciseLabelSerie()を使っている横座標データセットに、我々はSerie2を結びつけています。
我々は、グラフを描くために、drawFlatPieGraphWithShadow()とdrawPieLegend()を呼んでいます。
影のパラメーターは、setShadowProperties()機能を利用して設定しています。
このスクリプトを実行するとカレントディレクトリにExample13.phpファイルを作成します。

(訳注)この画像はサンプルコードのExample13.phpを出力したものです。
Example13.php ソースコード
<?php
 /*
     Example13: A 2D exploded pie graph
 */

 // Standard inclusions
 include("pChart/pData.class");
 include("pChart/pChart.class");

 // Dataset definition
 $DataSet = new pData;
 $DataSet->AddPoint(array(10,2,3,5,3),"Serie1");
 $DataSet->AddPoint(array("Jan","Feb","Mar","Apr","May"),"Serie2");
 $DataSet->AddAllSeries();
 $DataSet->SetAbsciseLabelSerie("Serie2");

 // Initialise the graph
 $Test = new pChart(300,200);
 $Test->setFontProperties("Fonts/tahoma.ttf",8);
 $Test->drawFilledRoundedRectangle(7,7,293,193,5,240,240,240);
 $Test->drawRoundedRectangle(5,5,295,195,5,230,230,230);

 // Draw the pie chart
 $Test->AntialiasQuality = 0;
 $Test->setShadowProperties(2,2,200,200,200);
 $Test->drawFlatPieGraphWithShadow($DataSet->GetData(),$DataSet->GetDataDescription(),120,100,60,PIE_PERCENTAGE,8);
 $Test->clearShadow();

 $Test->drawPieLegend(230,15,$DataSet->GetData(),$DataSet->GetDataDescription(),250,250,250);

 $Test->Render("example13.png");
?>