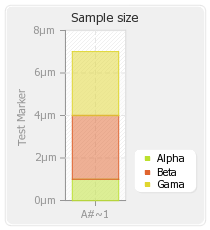
一つの積み重ねられた棒グラフ
Example SmallStacked
オリジナルのサイトでは例として紹介されていません。

(訳注)この画像はサンプルコードのSmallStacked.phpを出力したものです。
SmallStacked.php ソースコード
<?php
 /*
     Example21 : A single stacked bar graph
 */

 // Standard inclusions
 include("pChart/pData.class");
 include("pChart/pChart.class");

 // Dataset definition
 $DataSet = new pData;
 $DataSet->AddPoint(1,"Serie1");
 $DataSet->AddPoint(3,"Serie2");
 $DataSet->AddPoint(3,"Serie3");
 $DataSet->AddPoint("A#~1","Labels");
 $DataSet->AddAllSeries();
 $DataSet->RemoveSerie("Labels");
 $DataSet->SetAbsciseLabelSerie("Labels");
 $DataSet->SetSerieName("Alpha","Serie1");
 $DataSet->SetSerieName("Beta","Serie2");
 $DataSet->SetSerieName("Gama","Serie3");
 $DataSet->SetYAxisName("Test Marker");
 $DataSet->SetYAxisUnit("�m");

 // Initialise the graph
 $Test = new pChart(210,230);
 $Test->setFontProperties("Fonts/tahoma.ttf",8);
 $Test->setGraphArea(65,30,125,200);
 $Test->drawFilledRoundedRectangle(7,7,203,223,5,240,240,240);
 $Test->drawRoundedRectangle(5,5,205,225,5,230,230,230);
 $Test->drawGraphArea(255,255,255,TRUE);
 $Test->drawScale($DataSet->GetData(),$DataSet->GetDataDescription(),SCALE_ADDALLSTART0,150,150,150,TRUE,0,2,TRUE);
 $Test->drawGrid(4,TRUE,230,230,230,50);

 // Draw the 0 line
 $Test->setFontProperties("Fonts/tahoma.ttf",6);
 $Test->drawTreshold(0,143,55,72,TRUE,TRUE);

 // Draw the bar graph
 $Test->drawStackedBarGraph($DataSet->GetData(),$DataSet->GetDataDescription(),50);

 // Finish the graph
 $Test->setFontProperties("Fonts/tahoma.ttf",8);
 $Test->drawLegend(135,150,$DataSet->GetDataDescription(),255,255,255);
 $Test->setFontProperties("Fonts/tahoma.ttf",10);
 $Test->drawTitle(0,22,"Sample size",50,50,50,210);
 $Test->Render("SmallStacked.png");
?>